For every projection we extracted histograms before and after downscaling in the evaluation period that we compared to the observations distribution.
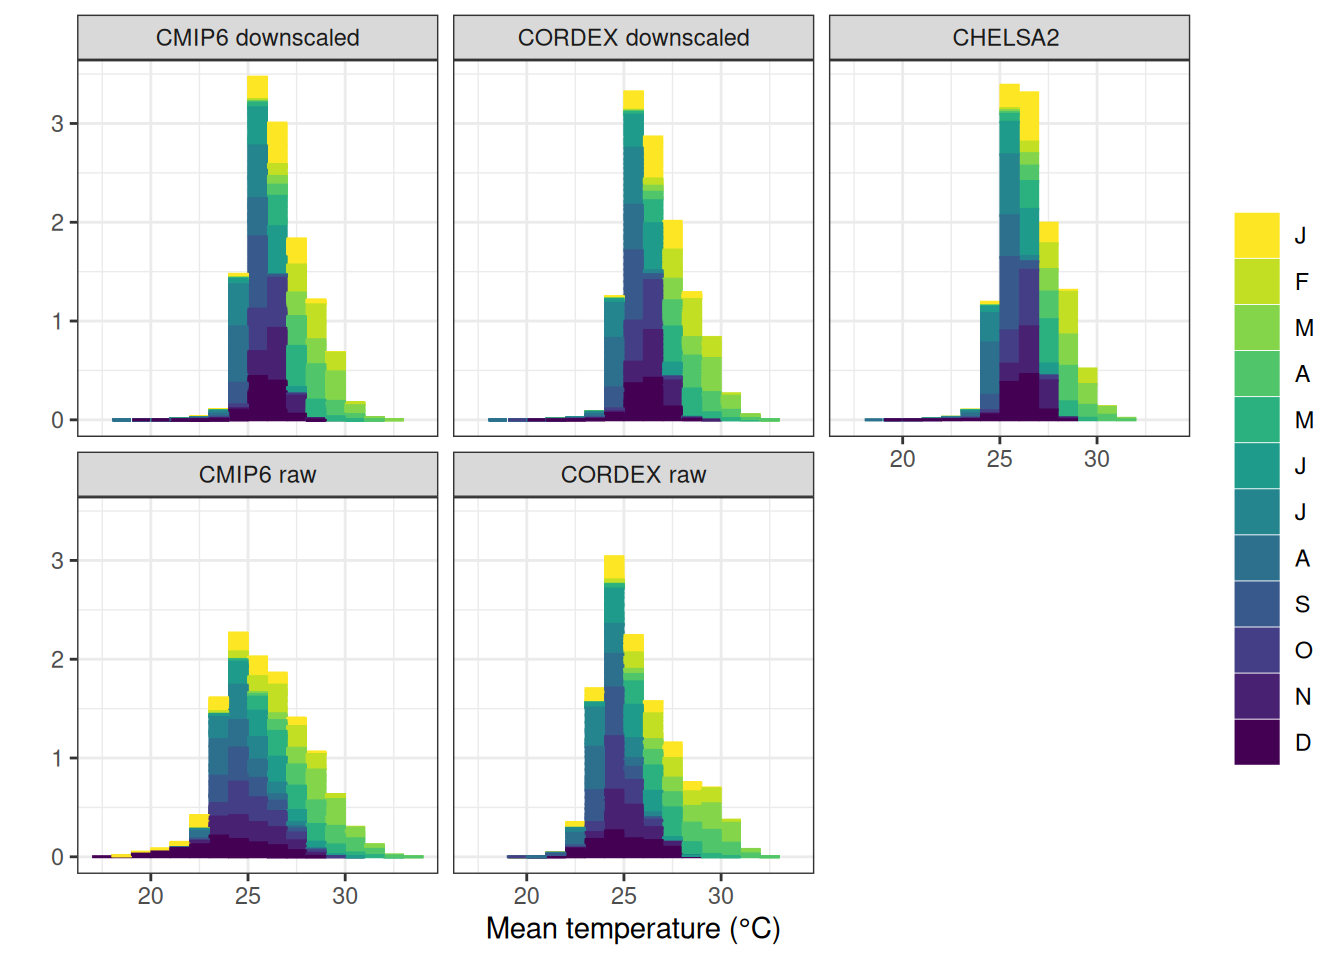
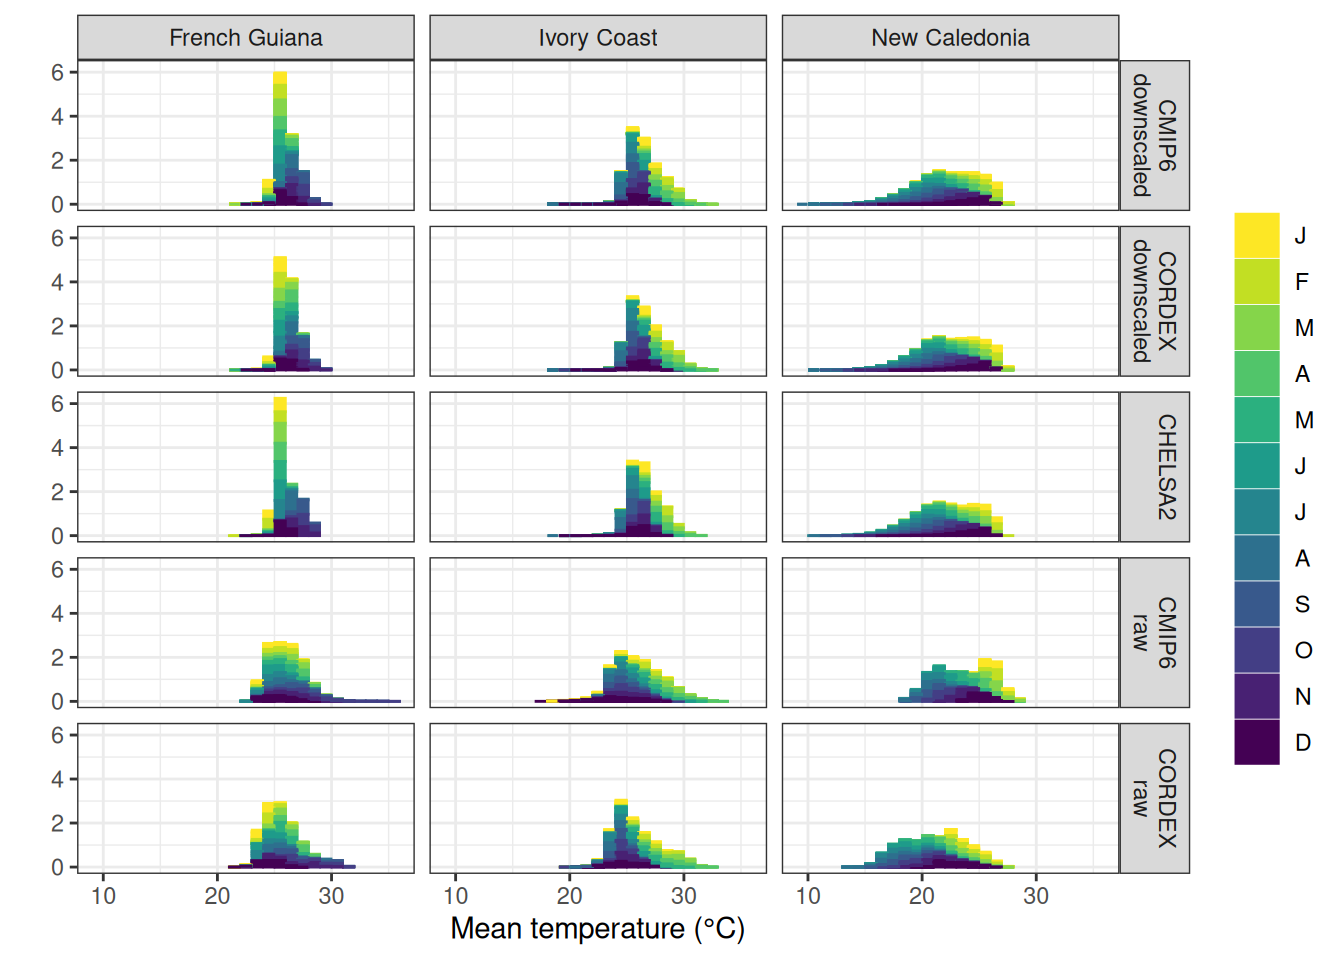
The effect of downscaling on histograms of temperature at surface was very country dependant. In Ivory Coast, histograms of temperature at surface revealed more spread distribution of temperature for raw CMIP6 and CORDEX projections compared to CHELSA 2, that downscaling correctly gathered and piked. However, both downscaling included a low temperature that CORDEX raw distributions were lacking. Similarly in French Guiana, histograms of temperature at surface revealed even more spread distribution of temperature for raw CMIP6 and CORDEX projections compared to CHELSA 2, that downscaling correctly gathered and piked. Oppositely in New Caledonia, histograms of temperature at surface revealed narrower distribution of temperature for raw CMIP6 projections compared to CHELSA 2, that downscaling correctly spread. Downscaling also extended the low temperature distribution of CORDEX, which was already pretty well distributed for high values.
Fig 2. Histograms of monthly mean temperature (°C) in Ivory Coast for all CMIP6 and CORDEX projections before and after downscaling compared to CHELSA 2. Bar colours indicate the month. Histograms for French Guiana, Ivory Coast and New Caledonia for temperature are shown in Supplementary Fig. S1 and for precipitation in Supplementary Fig. S2.
Fig. S1. Histograms of monthly mean temperature (°C) in French Guiana, Ivory Coast and New Caledonia for all CMIP6 and CORDEX projections before and after downscaling compared to CHELSA 2. Bar colours indicate the month.
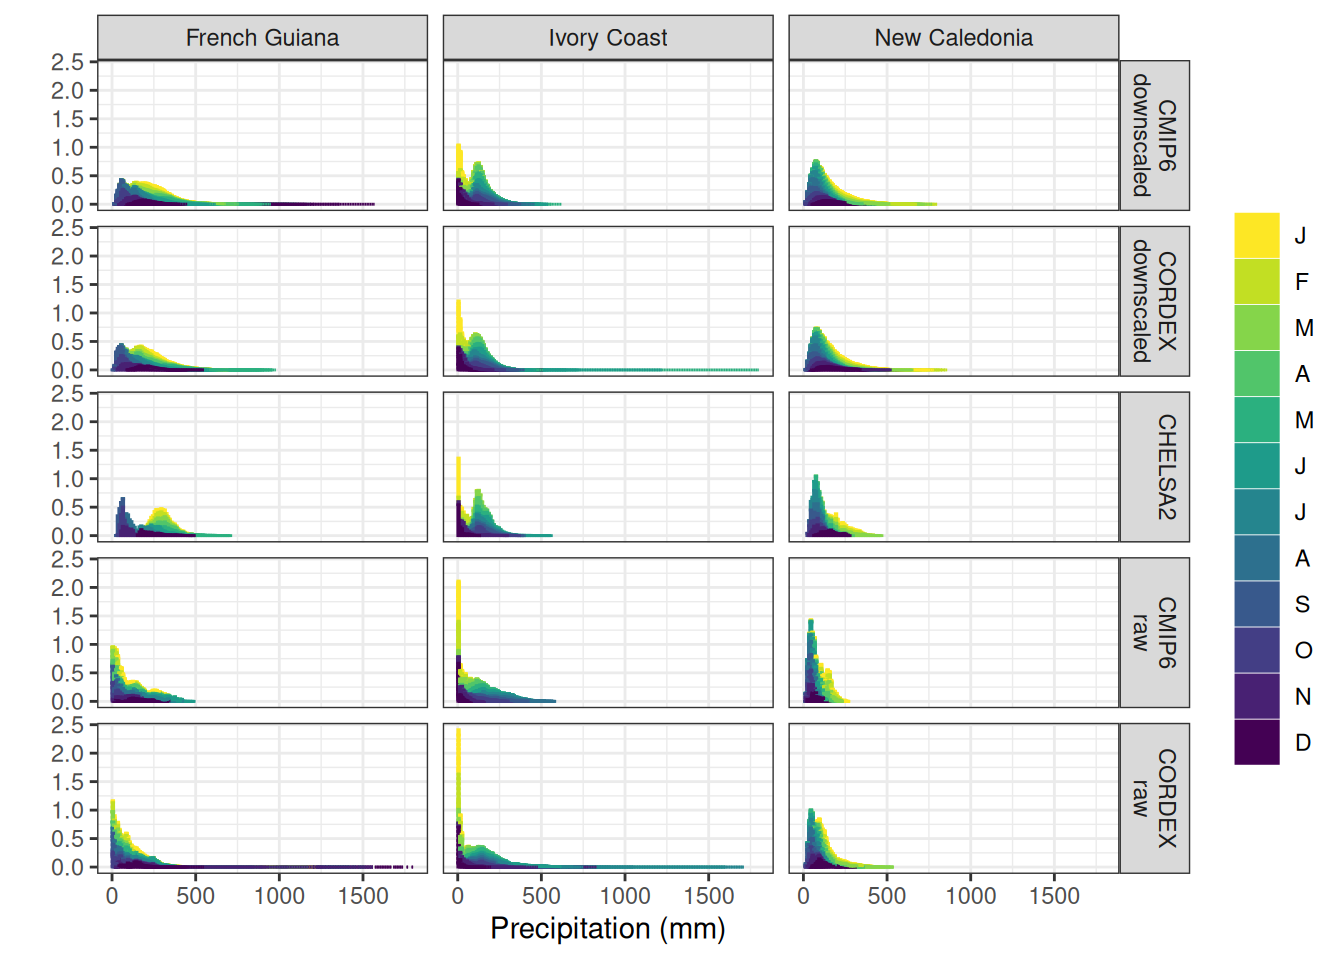
Fig. S2. Histograms of monthly precipitation (mm) in French Guiana, Ivory Coast and New Caledonia for all CMIP6 and CORDEX projections before and after downscaling compared to CHELSA 2. Bar colours indicate the month.